Our first Green Your Weekend post resulted in Congress banning microbeads, if we ignore the fact that correlation does not imply causation. We figured it only made sense to harness this blog’s obvious political influence with another easy tip to make your weekend a little greener! And because everyone’s thinking more pink than green this weekend, this suggestion can used to either a) impress your Valentine with your vast ocean knowledge or b) give you something productive to do while trying to forget it’s Valentine’s Day that does not involve buying and eating Walgreens’ entire stock of chocolate. Win-win!

The perfect chocolate to eat while mapping! Image from http://www.1worldglobalgifts.com/custom50zglobe.htm
The Nature Conservancy has a lot of terrific ocean resources for the general public, but one of their neatest ones is an effort called Mapping Ocean Wealth. According to their website, the project “visualizes in quantitative terms all that the ocean does for us today, so that we can make smarter investments and decisions for the ocean of tomorrow.” To understand why that’s so important, imagine you’re an illustrious scientist. You’ve published 42 papers on Caribbean mangroves, but you’re haunted by the possibility that publication was the most exciting thing to ever happen to your research. Perhaps it’s just languishing in journals, instead of being synthesized and applied to environmental management as you’d hoped. Cheer up, old chap! Thanks to Mapping Ocean Wealth (MOW), your science just might meet policy after all.
The MOW team starts by reviewing existing scientific literature, which of course includes your 42 imaginary publications. The project is currently focused on salt marshes, mangroves, coral reefs, sea grasses, shellfish reefs, and pelagic waters. The team is looking out for papers highlighting the ecosystem services provided by these habitats. To refresh, ecosystem services are natural ecosystem functions that are valued by humans. This value is traditionally translated into dollars, but MOW also considers less tangible benefits such as flood prevention and food security. All these lovely ecosystem services are then converted to spatial representations that can be mapped on their portal, which functions similarly to GIS only without all the baffling error messages.
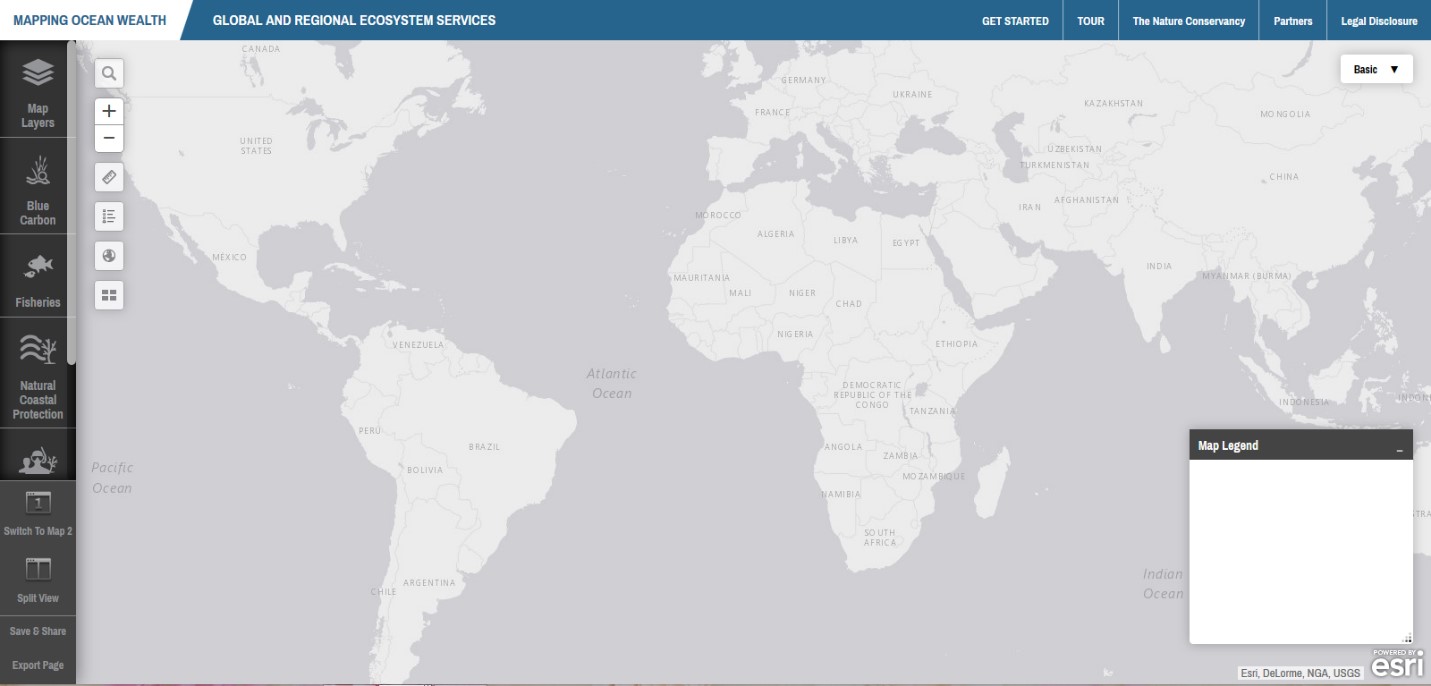
The default map view of the Mapping Ocean Wealth portal. Click on the image for a clearer view.
The portal will first prompt you to select a region of the world, as MOW has data for five at the moment. (Those literature reviews take a long time, people.) After that, the world is your oyster! Or mangrove, or coral reef: it seems that these two habitats are most represented on the MOW database at the moment. The most basic approach is to view one parameter, such as above-ground biomass of mangroves, shown below. Mangroves provide the ecosystem service of carbon storage, as noted in the MOW portal. By adding this layer to your map, you’re visualizing how mangrove biomass and, consequently, carbon storage vary spatially.

A map of above-ground mangrove biomass for the Caribbean. This parameter falls under Blue Carbon in the MOW. Based on this map, a manager would know to prioritize red zones with higher biomass. Screenshot from Mapping Ocean Wealth portal. Click on the image for a clearer view.
Mapping Ocean Wealth is potentially most interesting for its ability to visualize human and natural parameters. By splitting the screen, one can view two maps at once, enabling more sophisticated exploration. (It’s also possible to add multiple layers to a single map, but because the legend colors are often similar, it can be difficult to make sense of a multi-layer map.) Below is a screenshot of national GDP on the left alongside a map of tourism value from coral reefs on the right. High tourism potential doesn’t seem to be correlated with increased GDP, and that realization could prompt a manager to consider why that is and whether it’s a problem.
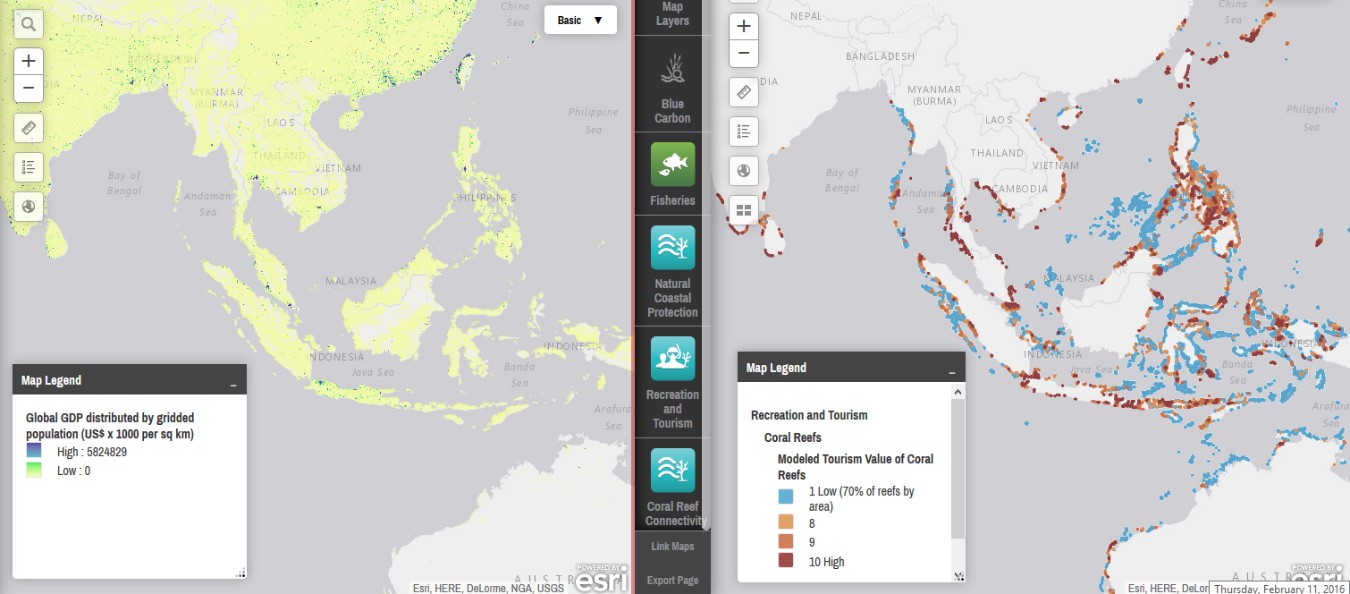
On left, a map of global GDP. On right, a map of modeled tourism value of coral reefs. The combination highlights the possibility that coral reef tourism isn’t translating into enhanced GDP- and that could raise questions as to why. Screenshot from Mapping Ocean Wealth. Click on the image for a clearer view.
Of course, the ultimate goal of MOW is loftier than amusing the average science geek. The Nature Conservancy is clear that MOW is meant to facilitate management decisions by creating a way to quickly view huge amounts of data. Environmental managers are generally pressed for money and time, and MOW enables them to prioritize where to spend each of those resources to achieve maximum results.
Admittedly, your weekend might be more blue than green if you take us up on this tip. But, loyal readers in Congress, we figure you can use all the environmental advice possible, so you have our encouragement to reference Mapping Ocean Wealth for your next landmark legislation!
Cover image from http://bluemossgirls.blogspot.com/2010/12/map-love.html
